Data Logs
You can push a data log captured on a mobile device to Neptune® 360™. The log data displays in grid format that you can sort and filter. Clicking an endpoint link displays the hourly readings, consumption, and event flags captured in the data log for the endpoint. The log includes unclaimed![]() Refers to an endpoint that is not part of a utility network. endpoints. The system marks the Account Name, Account Number, and Address as unclaimed for the data log entry, for logs that do not successfully link an endpoint ID and Site ID from the mobile device to a claimed asset in Neptune 360.
Refers to an endpoint that is not part of a utility network. endpoints. The system marks the Account Name, Account Number, and Address as unclaimed for the data log entry, for logs that do not successfully link an endpoint ID and Site ID from the mobile device to a claimed asset in Neptune 360.
You can export the data log to a PDF file or an Excel file for each view: 96 days, monthly, daily, and hourly.
An asterisk (*) appearing in the Data Log Report indicates that one or more data packets were missed during the data log capture process. When the system detects that it failed to receive an expected packet within the normal sequence, it flags that record with an asterisk to show there is a gap in the collected data.
Why a Packet Might Be Missed
A missed packet can occur for several reasons, including but not limited to:
-
Temporary communication interruptions.
-
Signal interference or environmental conditions.
-
Device or network congestion during transmission.
-
Momentary power or system interruptions.
These events are typically brief and do not indicate a failure of the device or logging system.
Impact on the Data
-
The asterisk does not mean the reported data is incorrect.
-
It simply indicates that one data interval was not captured.
-
Subsequent data points are recorded normally once communication resumes.
If precise, continuous interval data is required for analysis. Take note of any records marked with an asterisk.
Recommended Customer Action
No action is required in most cases. However, if asterisks appear frequently or consistently:
-
Verify communication signal strength.
-
Check for environmental or installation-related interference.
-
Contact technical support for further review.
-
Try the data log again closer to the meter location.

What You Can See and Do in This Window
Click a link to display the related information or step-by-step procedure.
| – | – | |
| – | – | |
| – | – | |
| – | – |
Display the Data Logs
- On the Neptune 360 navigation bar, click Data Logs.
The Data Logs screen is displayed.
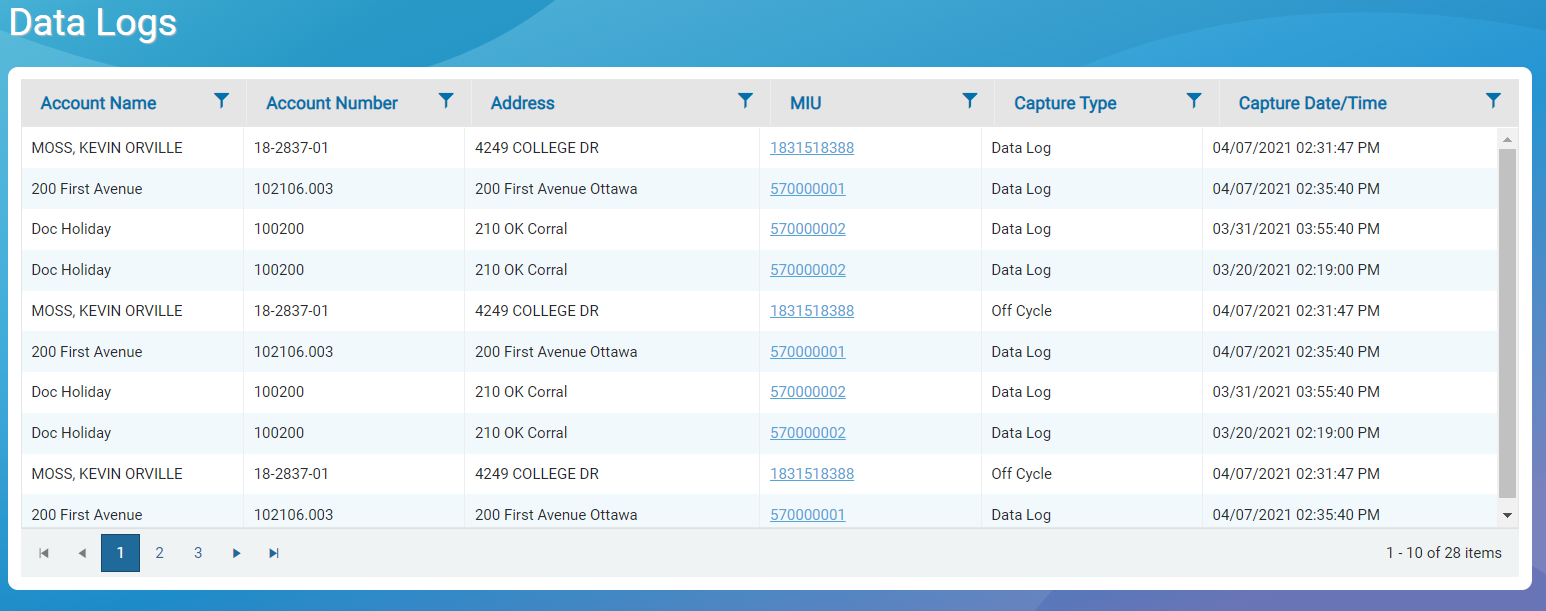
The following table defines the data that displays in the data logs grid.
| Data | Description |
|---|---|
| Account Name | Customer name on the account. |
| Account Number | Identifying number for the account. |
| Address | Address on the account. |
| Capture Date / Time | Date and time of the data capture in MM/DD/YYYY HH:MM:SS AM / PM |
| Capture Type |
Method used to capture data:
|
| Endpoint (MIU) | Number for the endpoint for the account. The number is a link that displays the data log details for the endpoint. |
Display Data Consumption Details
Each endpoint in the Data Log List is a link that displays the consumption details for the endpoint. The default display is for the past 96 days of consumption. You can change the display to show monthly consumption for the past four months, daily consumption for the past month, and hourly consumption. You can sort the grid data in ascending or descending order.
For the capture type, the details display:
-
Data Log capture – consumption recorded for the past 96 days in both graph and grid format. The graph includes flags for major and minor reverse flow, and continuous and intermittent consumption.
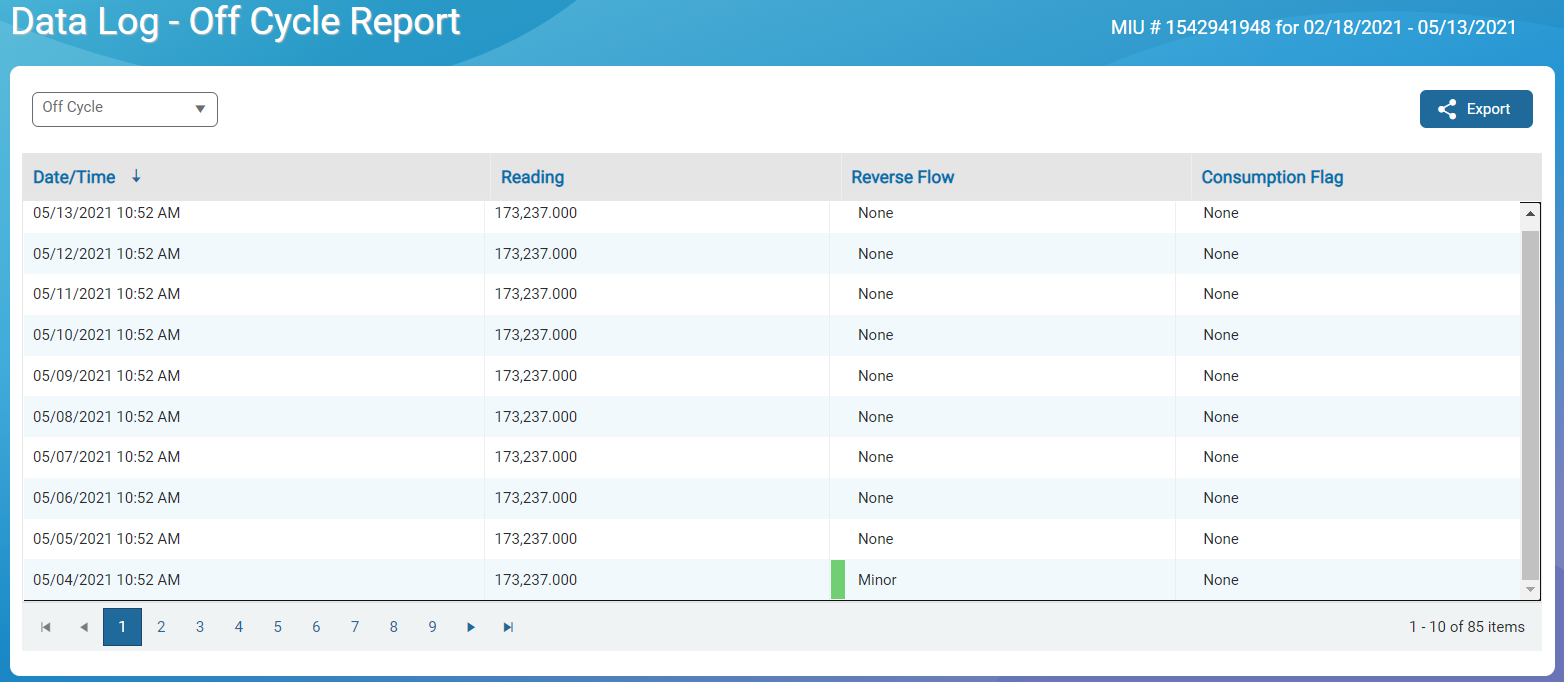
-
Off Cycle capture – hourly reading for 96 days, plus flags for major and minor reverse flow, and continuous and intermittent consumption.
Display Details for a Data Log Capture
- On the Neptune 360 navigation bar, click Data Logs.
- On the Data Logs page, on the data log list, click an endpoint (MIU) to display the consumption details for the endpoint.
The grid shows daily consumption for the past 96 days. The grid shows the date and time of each reading, the consumption, and related reverse flow and consumption flags.
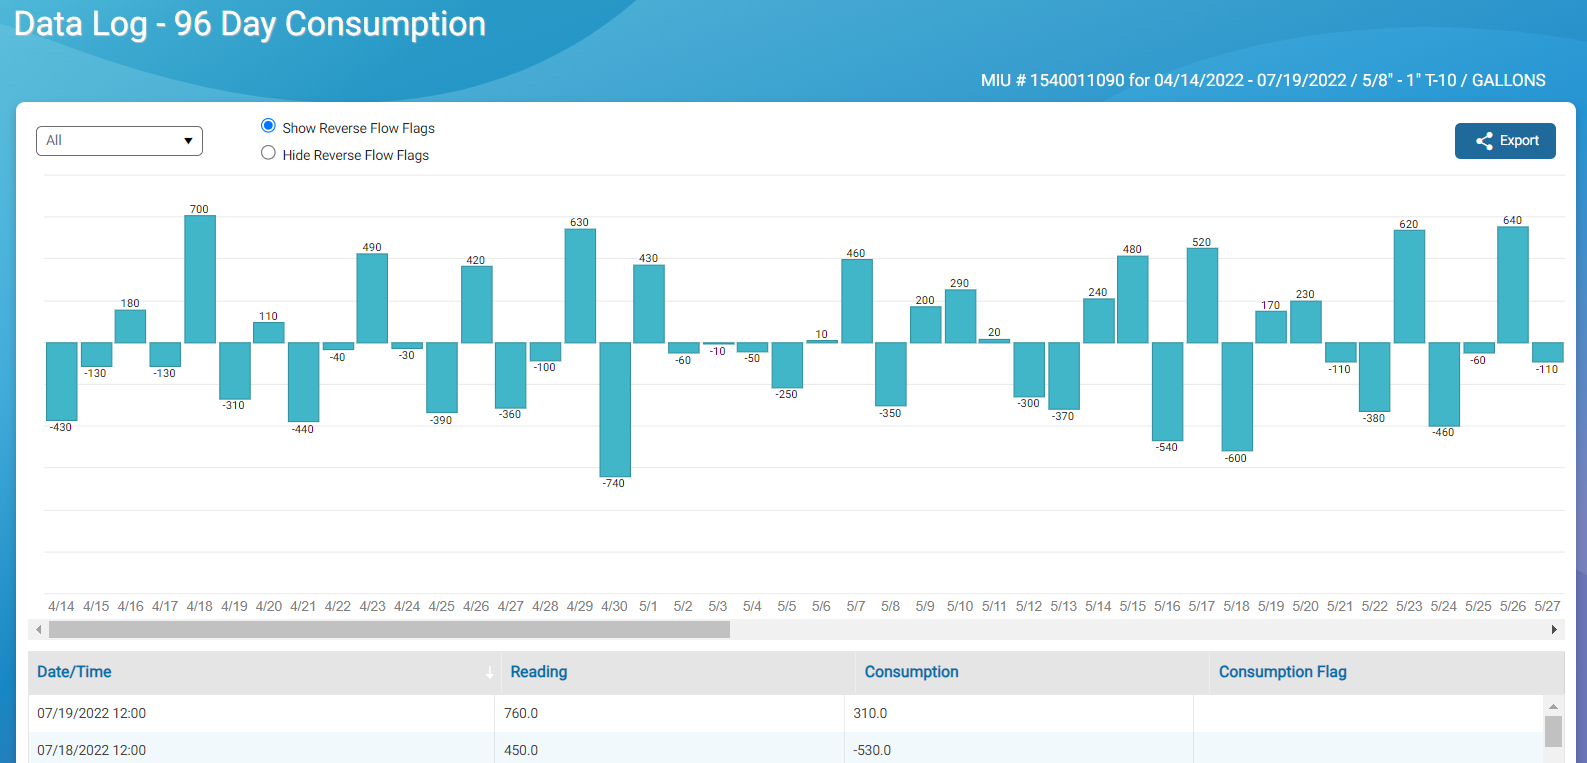
- Click any bar in the graph to display the consumption by hour.
After you display the hourly consumption, from the view options, you can select daily, monthly, or all readings for the past 96 days.
- To hide the reverse flow flags on the consumption view and the reverse flow column on the grid, select Hide Reverse Flow Flags.
- To return to the Data Log List, from the view options, select Data Log List.
Display Details for an Off Cycle Capture
- On the Neptune 360 navigation bar, click Data Logs.
- On the Data Logs page, on the Data Log List, click an endpoint (MIU) to display the consumption details for the endpoint.
The graph shows daily consumption for the past 96 days. The grid shows the date and time of each reading, the consumption, and related reverse flow and consumption flags.
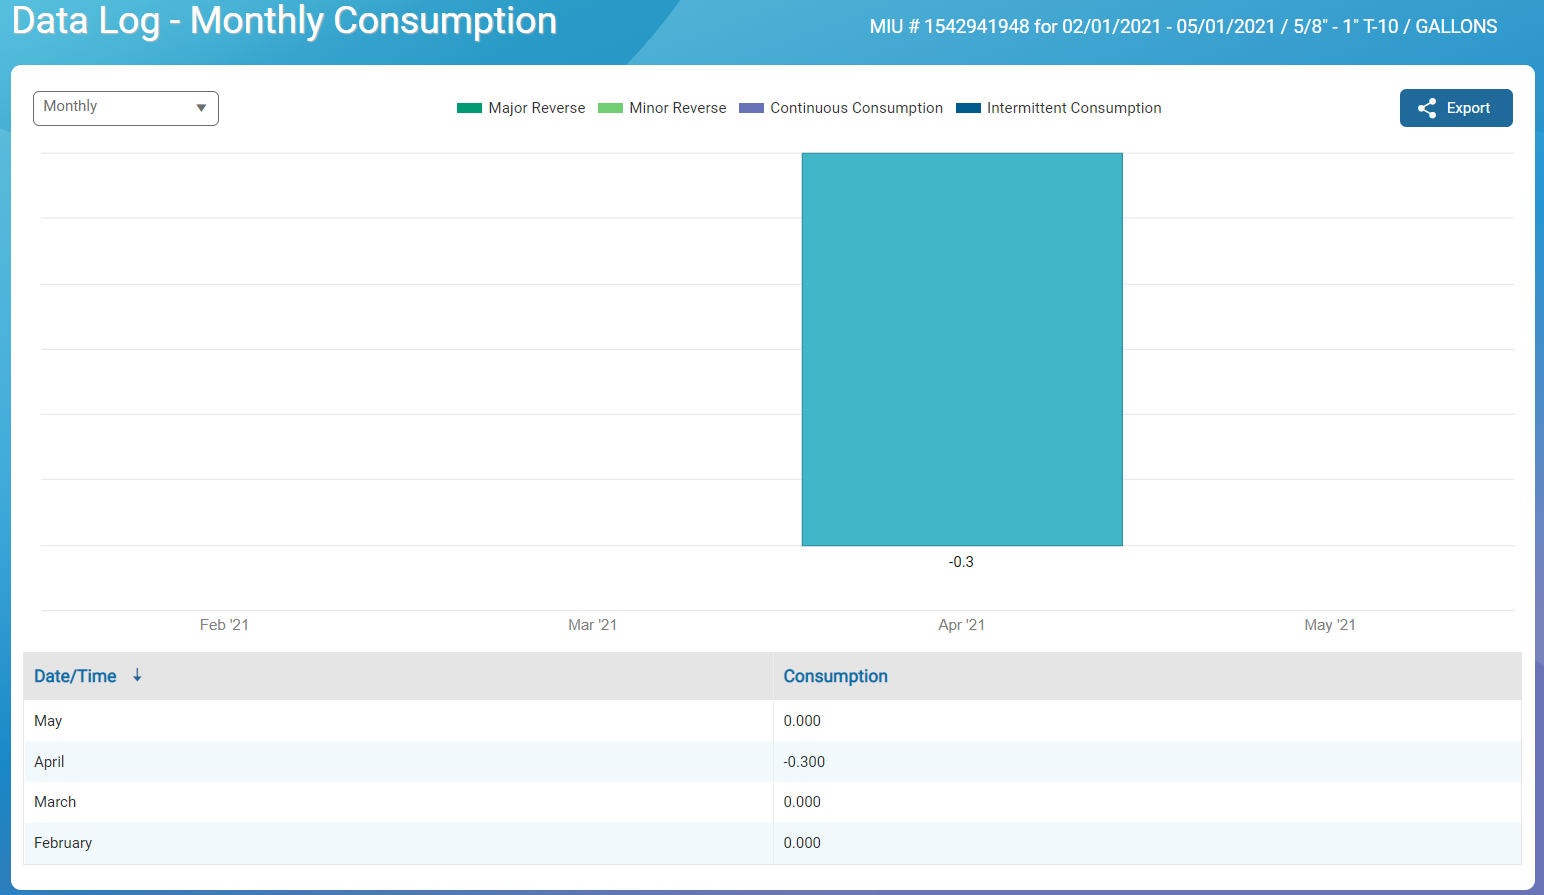
Display Monthly Consumption
The monthly consumption graph displays endpoint consumption for the past four months. The grid displays consumption, and the date and time.
- On the Neptune 360 navigation bar, click Data Logs.
- On the Data Logs page, on the data log list, click an endpoint (MIU) to display the consumption details for the endpoint.
- From the view options menu, select Monthly.
- To return to the Data Log List, from the view options, select Data Log List.
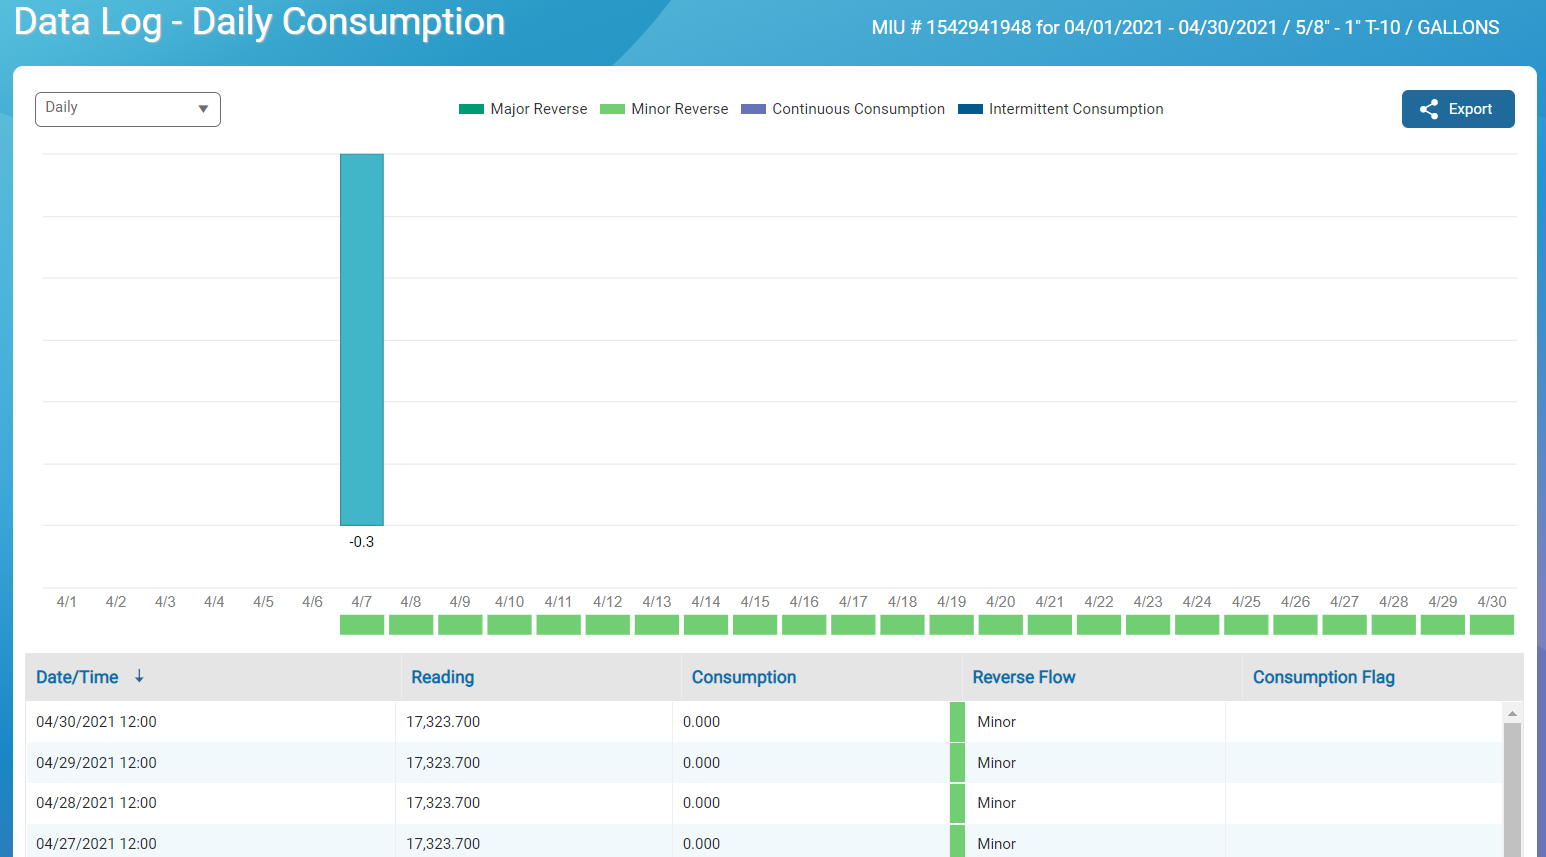
Display Daily Consumption
The daily consumption graph and grid displays endpoint consumption by day for the past month, plus flags for major and minor reverse flow, and continuous and intermittent consumption. You can display the daily consumption data only from the monthly graph.
- On the Neptune 360 navigation bar, click Data Logs.
- On the Data Logs page, on the data log list, click an endpoint (MIU) to display the consumption details for the endpoint.
- From the view options menu, select Monthly.
- Click a bar on the monthly graph to display the daily consumption graph and grid.
- To return to the Data Log List, from the view options, select Data Log List.
Display Hourly Consumption
The hourly consumption graph and grid displays endpoint consumption by day for the past month, plus flags for major and minor reverse flow, and continuous and intermittent consumption. You can display the daily consumption data only from the monthly graph.
- On the Neptune 360 navigation bar, click Data Logs.
- On the Data Logs page, on the data log list, click an endpoint (MIU) to display the consumption details for the endpoint.
- From the view options menu, select Monthly.
- Click a bar in the monthly consumption graph to display the daily consumption for that month.
- Click a bar in the daily consumption graph to display the hourly consumption for that day.

